Data Analysis
Downloading the Analysis ToolPak
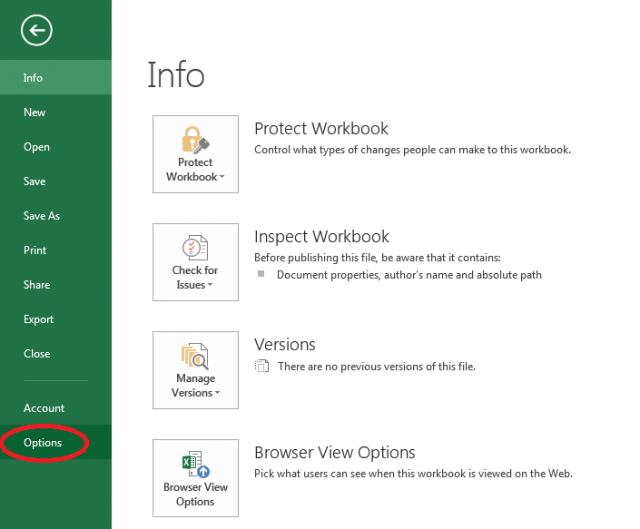
To download the Analysis ToolPak, click File on the upper left corner of the screen and select Options.
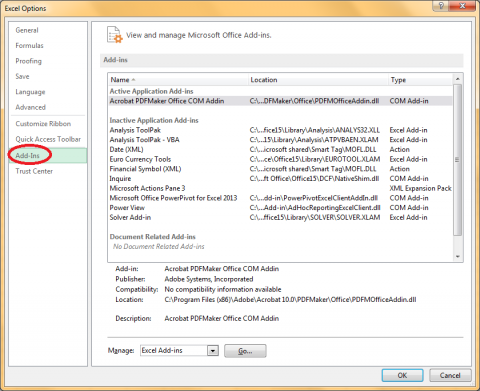
The following box will appear. Select Add-Ins.
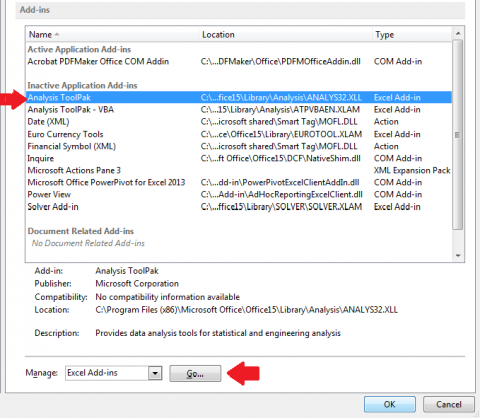
Select Analysis ToolPak in the middle of the window. You will see a drop down menu next to Manage at the bottom of the screen. Select Excel Add-ins and click Go.
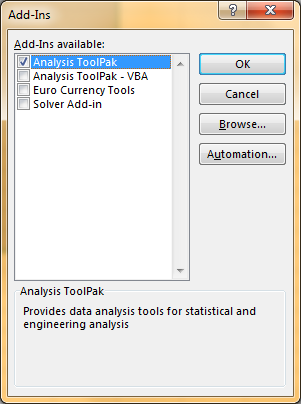
Another window will appear. Select the Analysis ToolPak and click OK. Note: if you would like to include Visual Basic for Application (VBA) functions, select Analysis ToolPak-VBA in addition to the regular Analysis ToolPak.
Accessing the Analysis ToolPak
Once you click OK, the Analysis ToolPak will be loaded into Excel. To access its functions, click on the Data tab and then Data Analysis on the upper right corner of the screen.

A window will appear with all of the available functions.
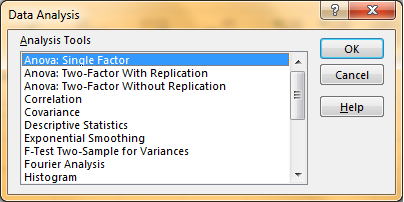
Single Factor ANOVA
Suppose we want to compare the means of multiple populations, but we don’t want to perform t-tests between all pairs. We can determine whether the difference between sample means is significant or not using Excel’s Single Factor ANOVA. (For more information about ANOVA, visit this site: https://statistics.laerd.com/statistical-guides/one-way-anova-statistical-guide.php )
- First load your data into Excel
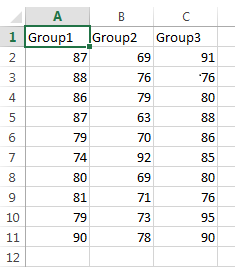
- Click on the Data tab and then select Data Analysis in the upper right corner of the screen.

If you do not see the Data Analysis option on the toolbar, you will need to first install the Analysis ToolPak (click here).
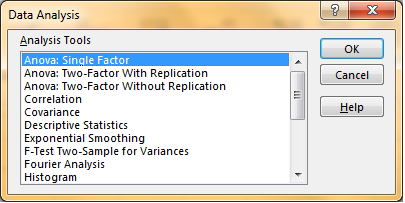
- Once you click on Data Analysis, the following box will appear. The first option will be Anova: Single Factor. Select it and click OK.
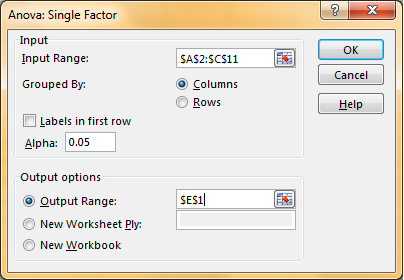
- You will be asked to select an input range. For this, select all of the data you would like to analyze without the labels (or select the labels and check the box that says “Labels in first row.” Also indicate whether your data is grouped by columns or rows, and input an alpha value (0.05 is standard). Finally, select an output range to display the results or select New Worksheet or New Workbook if you don’t want to display the results in your current worksheet.
The following chart will appear in your worksheet.
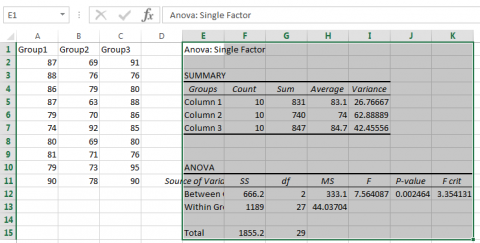
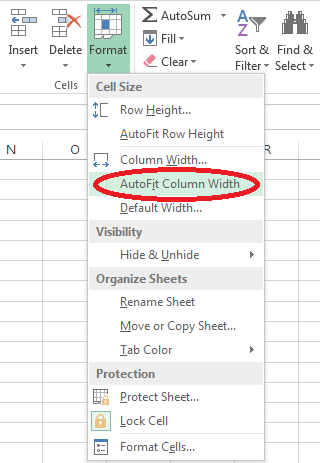
- To clean up the formatting, select Format under the Home tab and then click AutoFit Column Width.
The table will look much more presentable:
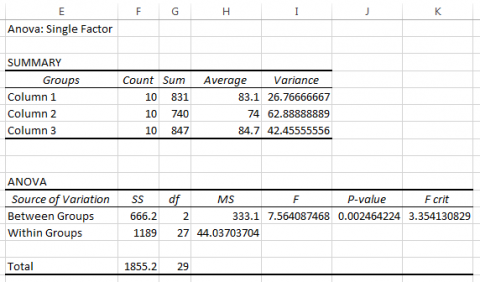
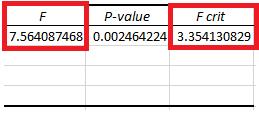
- Interpreting the results: If F is larger than F crit, we must reject the null hypothesis. That is, there is a significant difference between the population means. Also, note that the p-value is much smaller than our alpha value .05, which is another indication that we must reject the null hypothesis.
Site Footer
Previous: Formulas & Functions